이 글은 아래의 자료를 참고로 만들어졌습니다.
docs.ros.org/en/dashing/Tutorials/Topics/Understanding-ROS2-Topics.html
Understanding ROS 2 topics — ROS 2 Documentation: Dashing documentation
You're reading the documentation for an older, but still supported, version of ROS 2. For information on the latest version, please have a look at Foxy. Understanding ROS 2 topics Goal: Use rqt_graph and command line tools to introspect ROS 2 topics. Tutor
docs.ros.org
Understanding ROS 2 topics
Goal: Use rqt_graph and command line tools to introspect ROS 2 topics.
Tutorial level: Beginner
Background
ROS 2는 복잡한 시스템을 많은 모듈식 노드들로 나눕니다.
Topics은 ROS graph에 핵심 요소이며, 메세지를 교환하는 bus역할을 합니다.

하나의 노드는 많은 topics을 이용하여 데이터를 publish할 수 있고,
동시에 많은 topics을 subscribe할 수 있습니다.

Topics은 node들 간에, 즉 시스템의 다른 부분 간의 데이터를 이동하는 중요한 방법 중 하나입니니다.
Prerequisites
이전 튜토리얼의 node에 대한 배경지식이 필요합니다.
turtlesim package가 필요합니다.
또한, 항상 새로운 터미널에 설정파일을 소싱하는 것을 잊지 마세요.
Tasks
1 Setup
새 터미널을 열어 아래의 명령을 실행합니다.
$ ros2 run turtlesim turtlesim_node또 다른 터미널을 열어 아래의 명령을 실행합니다.
$ ros2 run turtlesim turtle_teleop_key이전 튜토리얼에서 default node의 이름들이 /turtlesim과 /teleop_turtle이었다는 것을 기억하세요.
2 rqt_graph
이번 튜토리얼을 통해
nodes와 topics의 변화와 그들 사이 관계를 시각화할 수 있는
rqt_graph를 사용해보겠습니다.
$ rqt_graph또한 rqt를 실행하여
$ rqtPlugins > Introspection > Nodes Graph을 선택하여
rqt_graph를 실행할 수 있습니다.

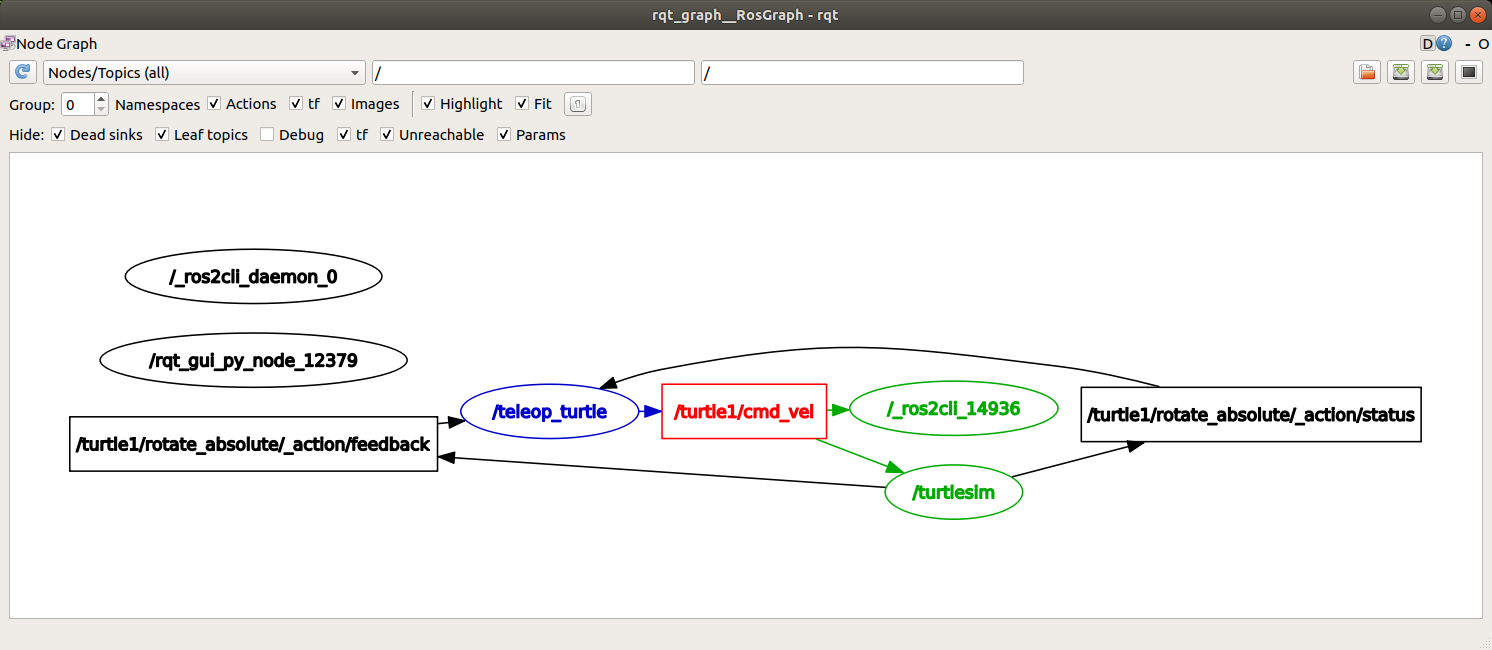
nodes와 topic, 그리고 actions를 볼 수 있습니다.
(여기서는 가장자리에 있는 actions은 제외하고 살펴보겠습니다.)
만약 마우스 커서를 가운데의 네모박스의 topic에 갖다대면,
위 그림과 같이 색깔이 바뀌며 강조되는 것을 볼 수 있습니다.
위 그래프는 /turtlesim node와 /teleop_turtle node가
topic을 통해 서로 통신하는 방식을 보여줍니다.
/teleop_turtle node가 키보드 입력 데이터를 /turtle1/cmd_vel topic을 이용하여 publishing하고,
/turtlesim node는 전달된 데이터를 topic을 통하여 subscribe합니다.
rqt_graph의 색깔이 바뀌는 기능은
더 복잡한 시스템의 수 많은 노드들과 토픽들이
서로 복잡하게 연결될 때 큰 도움이 됩니다.
rqt_graph가 graphical한 검사 도구였다면,
command line으로 topic을 검사하는 방법을 알아보겠습니다.
3 ros2 topic list
새 터미널에 ros2 topic list 명령을 실행하면,
현재 실행 중인 topics list를 보여줍니다.
$ ros2 topic list

/parameter_events
/rosout
/turtle1/cmd_vel
/turtle1/color_sensor
/turtle1/pose
ros2 topic list -t 명령은
이전 명령에 추가로 topic type을 brackets으로 감싸 보여줍니다.
$ ros2 topic list -t

/parameter_events [rcl_interfaces/msg/ParameterEvent]
/rosout [rcl_interfaces/msg/Log]
/turtle1/cmd_vel [geometry_msgs/msg/Twist]
/turtle1/color_sensor [turtlesim/msg/Color]
/turtle1/pose [turtlesim/msg/Pose]
Topics은 names와 types를 가지고 있습니다.
이러한 속성(특히, type)은 topics을 통해 node들이 동일한 information을 주고 받음을 알 수 있습니다.
rqt_graph에서
만약 모든 topcis을 보고 싶다면, Hide의 체크박스를 해제하면 됩니다.

4 ros2 topic echo
topic의 publish된 데이터를 보기 위해 아래 명령어를 실행합니다.
$ ros2 topic echo <topic_name>/teleop_turtle은 /turtle1/cmd_vel topic을 통해 /turtlesim으로
데이터를 publish합니다.
echo를 사용하여 topic을 검사해보면 다음과 같습니다.
$ ros2 topic echo /turtle1/cmd_vel

linear:
  x: 2.0
  y: 0.0
  z: 0.0
angular:
  x: 0.0
  y: 0.0
  z: 0.0
  ---
  ...(생략)
맨 처음에는 어떠한 데이터도 보여주지 않습니다.
그 이유는 /teleop_turtle이 data를 publish할 때까지 기다리기 때문입니다.
turtle_teleop_key가 실행된 터미널을 활성화시키고
키보드 화살표 버튼을 이용하여 turtle을 움직여봅시다.
그와 동시에 echo를 실행한 터미널을 보면,
매번 움직일 때마다 위치 데이터가 publish된 것을 볼 수 있습니다.
이제 rqt_graph로 돌아가서
Debug box만 체크를 해제하고 새로고침을 누릅니다.

/_ros2cli_14936은 echo에 의해 생긴 노드입니다(숫자는 다를 수 있습니다.).
publisher(/teleop_turtle)이 cmd_vel topic을 통하여 data를 publishing하고,
2개의 subscribers(/_ros2cli_14936, /turtlesim)는 subscribed하는 것을 볼 수 있습니다.
5 ros2 topic info
Topics은 일대일 통신만 하는 것은 아닙니다.
일대다, 다대일, 다대대 통신도 가능합니다.
이러한 것을 확인하는 명령은 아래와 같습니다.
$ ros2 topic info /turtle1/cmd_vel

Topic: /turtle1/cmd_vel
Publisher count: 1
Subscriber count: 2
6 ros2 interface show
Nodes는 messages를 topics을 통해 데이터를 보냅니다.
Publishers과 subscribers는 반드시 같은 type의 message를 주고 받아야합니다.
이전 ros2 topic list -t를 사용하여
각각의 topic이 어떠한 type의 messages를 보낼 수 있는지 알 수 있었습니다.
cmd_vel topic의 타입은 아래와 같습니다.
$ ros2 topic list -t

(생략)..
/turtle1/cmd_vel [geometry_msgs/msg/Twist]
..(생략)
geometry_msgs package에 msg안에 있는 Twist를 호출했다는 의미입니다.
ros2 msg show <type>.msg 명령어를 사용하여
data의 구조와 그 상세적인 부분을 알 수 있습니다.
$ ros2 msg show geometry_msgs/msg/Twist

# This expresses velocity in free space broken into its linear and angular parts.

    Vector3  linear
    Vector3  angular
이 의미는 /turtlesim node는 총 2개의 vectors(linear와 angular)를 받으며,
linear와 angular는 각각 3개의 elements를 가지고 있음을 확인할 수 있습니다.
이전의 echo 명령을 통해
보았던 데이터와 구조가 같음을 확인할 수 있습니다.
$ ros2 topic echo /turtle1/cmd_vel

linear:
  x: 2.0
  y: 0.0
  z: 0.0
angular:
  x: 0.0
  y: 0.0
  z: 0.0
  ---
  ...(생략)
7 ros2 topic pub
이제 message의 구조를 알았으니
아래의 명령을 사용하여
command line에 직접 data를 publishing할 수 있습니다.
$ ros2 topic pub <topic_name> <msg_type> '<args>''<args>'는 topic에게 줄 실제 data를 넣어주면 됩니다.
이 argument는 입력으로 YAML syntax을 사용합니다.
cmd_vel topic은 아래와 같이 실행할 수 있습니다.
$ ros2 topic pub --once /turtle1/cmd_vel geometry_msgs/msg/Twist "{linear: {x: 2.0, y: 0.0, z: 0.0}, angular: {x: 0.0, y: 0.0, z: 1.8}}"

publisher: beginning loop
publishing #1: geometry_msgs.msg.Twist(linear=geometry_msgs.msg.Vector3(x=2.0, y=0.0, z=0.0), angular=geometry_msgs.msg.Vector3(x=0.0, y=0.0, z=1.8))
--once는 한 번 publish한고 종료하겠다는 뜻입니다.
그리고 turtle이 아래와 같이 한 번 움직였음을 볼 수 있습니다.

그리고 turtle을 계속 움직이게 하고 싶다면,
--once 옵션을 제거하고 --rate 1을 추가하여
1Hz로 명령어를 계속 publish하도록 명령을 실행시킵니다.
$ ros2 topic pub --rate 1 /turtle1/cmd_vel geometry_msgs/msg/Twist "{linear: {x: 2.0, y: 0.0, z: 0.0}, angular: {x: 0.0, y: 0.0, z: 1.8}}"

publisher: beginning loop
publishing #1: geometry_msgs.msg.Twist(linear=geometry_msgs.msg.Vector3(x=2.0, y=0.0, z=0.0), angular=geometry_msgs.msg.Vector3(x=0.0, y=0.0, z=1.8))

publishing #2: geometry_msgs.msg.Twist(linear=geometry_msgs.msg.Vector3(x=2.0, y=0.0, z=0.0), angular=geometry_msgs.msg.Vector3(x=0.0, y=0.0, z=1.8))

publishing #3: geometry_msgs.msg.Twist(linear=geometry_msgs.msg.Vector3(x=2.0, y=0.0, z=0.0), angular=geometry_msgs.msg.Vector3(x=0.0, y=0.0, z=1.8))

...(생략)

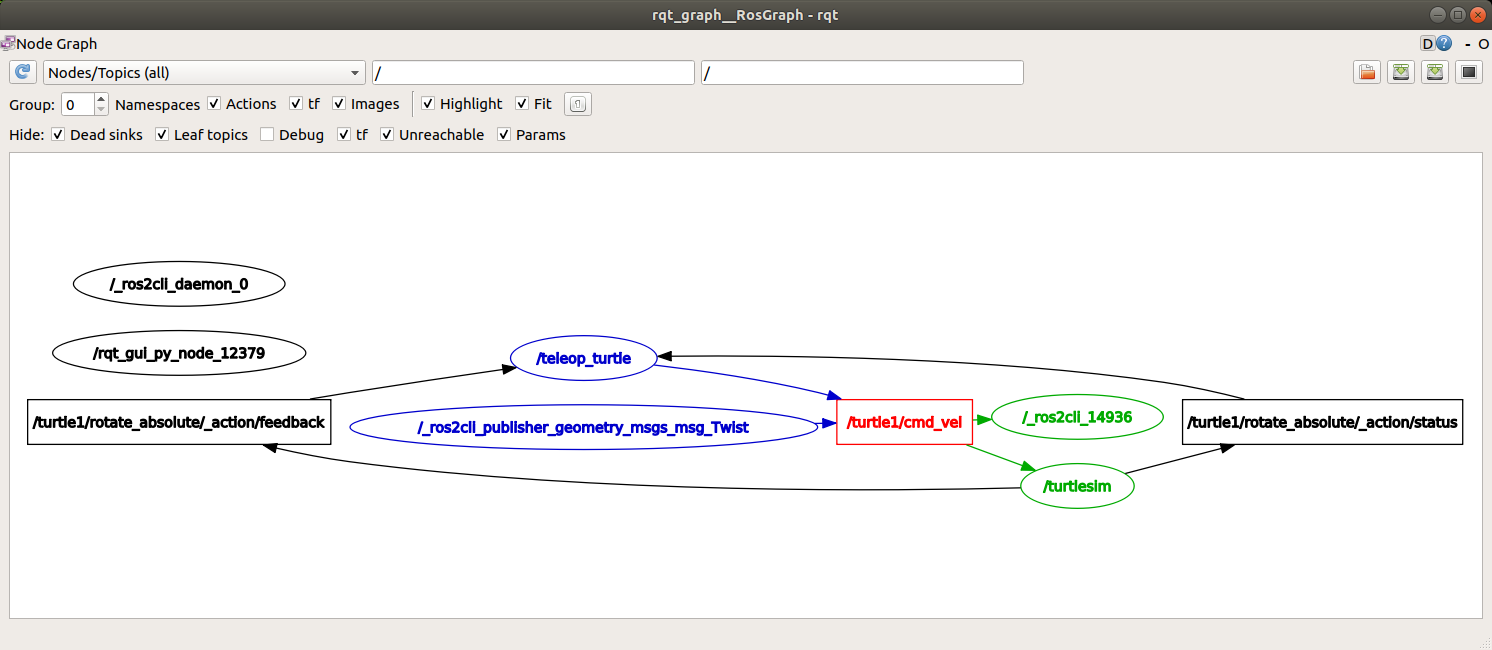
rqt_graph를 새로고침하면,
ros2 topic pub ... node(/_ros2cli_publisher_geometry_mss_msg_Twits)가 /turtle1/cmd_vel topic으로 publishing하고,
ros2 topic echo ... node(/_ros2cli_14636)과 /turtlesim node가 received하는 것을 알 수 있습니다.

마지막으로
pose topic에 대하여 echo하고
rqt_graph로 다시 확인하면 아래와 같습니다.
$ ros2 topic echo /turtle1/pose

x: 5.8612141609191895
y: 5.595319747924805
theta: 0.2897184193134308
linear_velocity: 2.0
angular_velocity: 1.7999999523162842
---
x: 5.891604423522949
y: 5.605340957641602
theta: 0.31851842999458313
linear_velocity: 2.0
angular_velocity: 1.7999999523162842
---
x: 5.921693801879883
y: 5.616232872009277
theta: 0.3473184406757355
linear_velocity: 2.0
angular_velocity: 1.7999999523162842
---
...(생략)

여기서는, /turtlesim node가 pose topic을 publishing하고,
echo node가 subscribed합니다.
8 ros2 topic hz
마지막 ros2 topic echo ... 명령에 대해
published하는 rate를 확인하는 방법은 다음과 같습니다.
$ ros2 topic hz /turtle1/pose

average rate: 62.541
	min: 0.014s max: 0.018s std dev: 0.00063s window: 64
average rate: 62.524
	min: 0.014s max: 0.018s std dev: 0.00053s window: 127
average rate: 62.499
	min: 0.014s max: 0.018s std dev: 0.00056s window: 190
...(생략)
$ ros2 topic hz /turtle1/cmd_vel
average rate: 1.000
min: 1.000s max: 1.000s std dev: 0.00005s window: 2
average rate: 1.000
min: 1.000s max: 1.000s std dev: 0.00005s window: 3
average rate: 1.000
min: 1.000s max: 1.000s std dev: 0.00004s window: 4
...()cmd_vel의 경우 --rate 1의 옵션을 주어,
위와 같은 결과가 나온 것을 확인 할 수 있습니다.
9 Clean up
이 시점에는 수 많은 노드들이 실행되고 있을 것입니다.
이를 종료하기 위해서는
terminal windows를 닫거나
Ctrl+C를 각 터미널에 입력하여 종료할 수 있습니다.